See Your City’s Heat. Decide Where to Cool It.
HeatAtlas turns satellite data into clear, actionable maps so cities can target cooling investments where they matter most.
From Raw Pixels to City-Ready Heat Insights
Our pipeline transforms multi-spectral satellite imagery and local sensor data into block-level insights for urban planners and climate officers.
Assess heat risk by district
Pinpoint the hottest neighborhoods and blocks with satellite-derived Land Surface Temperature. Compare districts side-by-side, overlay demographics and vulnerability indices, and prioritize interventions where they’ll have the biggest impact.
Explore heat map Soon availablePlan cooling and greening projects
Model where trees, green roofs, and cool surfaces will deliver the largest temperature drop. Use before/after scenarios and cost layers to align cooling investments with budget and policy goals.
Try scenario tool Soon availableReport climate resilience progress
Generate instant, board-ready reports. Track cooling metrics over time and prove the ROI on green infrastructure investments to stakeholders and grant boards with irrefutable satellite data.
View sample report Soon availableDesign, target and track your city’s cooling strategy.
Leverage satellite Land Surface Temperature (LST) with multispectral context to identify urban heat islands, explain drivers, prioritize interventions, and track change across dates.
Effortless, map-first heat intelligence
HeatAtlas ingests complex thermal satellite data and normalizes it into a single, lightning-fast interactive platform. Explore historical time-series, overlay demographics, and export ready-made reports without GIS expertise.
-
Identify and rank urban heat islands down to the block.
-
Simulate cooling impact of trees, shading and materials.
-
Share clear visual stories with residents and decision-makers.
See HeatAtlas in action.
A real interface screenshot from the HeatAtlas platform—showing how your team can browse heat maps, zoom into critical districts, and export insights in seconds.
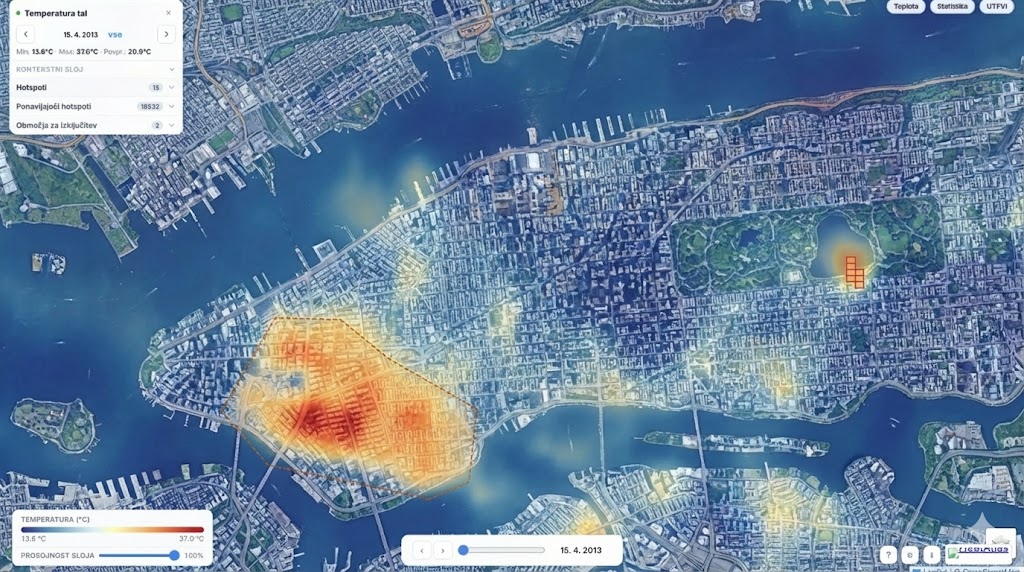
Real-time heat maps and cooling insights, exactly as your team will see them in the app.
Why cities and planners trust HeatAtlas with their heat strategy.
We believe that effective climate resilience begins with absolute spatial clarity. Our mission is to bridge the gap between complex earth observation science and the daily realities of urban planning and public policy.
By partnering with leading space agencies and municipalities worldwide, HeatAtlas ensures that every investment—whether it’s a new park, reflective roofing, or a cooling center—is backed by rigorous, transparent, and continuously updated thermal baselines.
Who should adopt a heat intelligence platform like HeatAtlas?


Urban planners
Integrate thermal data directly into zoning and master plans.

Consultants & NGOs
Build evidence-based cases for green infrastructure funding.

Infrastructure & utilities
Protect critical grid assets vulnerable to extreme heat events.
✦ HeatAtlas is designed for teams making real-world investments—where every tree, roof and square meter counts.
Frequently asked questions
- What is HeatAtlas?
- HeatAtlas is a heat intelligence platform that converts satellite Land Surface Temperature (LST) data into interactive maps and planning tools so cities can locate urban heat islands, prioritize cooling investments, and report climate resilience progress.
- What data does HeatAtlas use?
- Satellite land surface temperature (~30m class), multispectral indices (NDVI, NDMI, NDBI, MNDWI), and optional LiDAR for building height—combined into district- and block-level insights, not raw imagery alone.
- What’s in the HeatAtlas app?
- Hotspots and recurring heat islands, UTFVI, correlation analysis (“why is it hot here”), AI cooling suggestions, energy and vulnerability layers, 3D and LiDAR views, plus CSV and PNG export—on cloud or on-premise.
- Who is HeatAtlas for?
- City governments, urban planners, adaptation consultants, NGOs, and infrastructure teams that need defensible heat evidence for cooling strategies, green infrastructure funding, and master planning—without requiring GIS specialists on staff.
- How does pricing work?
- Pricing is tailored to your city size, data needs, and timeline. Request a quote via the form below or email hi@heatatlas.com.
- How is HeatAtlas different from generic GIS?
- HeatAtlas is built for urban heat workflows: LST normalization, modules such as Hotspots and GreenIndex, cooling scenario planning, and stakeholder-ready reporting—not general-purpose map editing.
Turn heat risk into
a clear, actionable plan.
Get a tailored HeatAtlas quote — see pricing aligned to your city size, data needs and timelines.
A few quick questions, then a clear, no-obligation offer.